
Unit Vector Explained

In the last article, we learned how to compute the length of a vector. In this article, we will understand what is a unit vector and understand how to find this unit vector in algebraic way and understand the geometric intuition.
Unit Vector
The term unit in the context of a vector means that the vector has a length of one:
Let’s say there is a vector v and a scalar mu, then the scaled vector v will have a length of magnitude of one:
Ok, now lets understand how to get a unit vector given a vector:
Here, the important questions is to find what “mu” value will scale the vector to the length of 1, giving us the unit vector.
If you think in terms of regular numbers, then you just need to multiply it by its reciprocal and you’ll get one as the result.
So, if you will translate that to vectors concept, then we just need to take the reciprocal of the magnitude of the vector and multiply with its own magnitude and we will get the unit vector.
Let’s prove this:
From our above explanation, our hypothesis is that we need to take the reciprocal of the magnitude of vector v and multiply that we magnitude of vector v and we will get the unit vector with the length of 1:
You can see from the above equation that the magnitude of vector v will cancel out and 1 will remain in RHS. Hence, we can say that our hypothesis is correct and we proved the formula to find the unit vector of any given vector.
There is no unit vector for a zero vector, this makes sense geometrically as a zero vector signifies a point at the origin. It has not magnitude or length or direction, so its not possible to have a length of 1 in this case.
Now, lets do this in python and then we will wrap up.
Unit Vector in Python
First, import the usual stuff
import numpy as np
import matplotlib.pyplot as plt
# vector
v1 = np.array([ -3, 6 ])

# mu
mu = 1/np.linalg.norm(v1)

v1n = v1*mu

# plot them
plt.plot([0, v1n[0]],[0, v1n[1]],'r',label='v1-norm',linewidth=5)
plt.plot([0, v1[0]],[0, v1[1]],'b',label='v1')

# axis square
plt.axis('square')
plt.axis(( -6, 6, -6, 6 ))
plt.grid()
plt.legend()
plt.show()
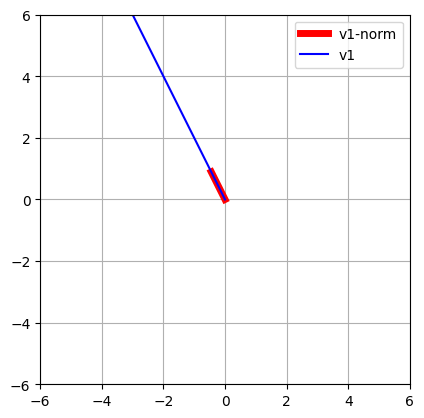
We created a simple 2d vector and then kept the mu value as the reciprocal of the vector’s magnitude and then multiplied both of them and finally we are plotting them.
I hope this quick one is very easy to digest and in the next one we will understand about dimensions and fields in linear algebra. Till then, Goodbye!